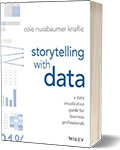
Storytelling with data
Data Science
Book Details
Book Title
Storytelling with data
Author
Cole Nussbaumer Knaflic
Publisher
Wiley
Publication Date
2015
ISBN
9781119002253
Number of Pages
796
Language
English
Format
File Size
4.2MB
Subject
Data science
Table of Contents
- contents
- foreword
- acknowledgments
- about the author
- introduction
- Bad graphs are everywhere
- We aren’t naturally good at storytelling with data
- Who this book is written for
- How I learned to tell stories with data
- How you’ll learn to tell stories with data: 6 lessons
- Illustrative examples span many industries
- Lessons are not tool specific
- How this book is organized
- chapter one the importance of context
- Exploratory vs. explanatory analysis
- Who, what, and how
- Who
- What
- How
- Who, what, and how: illustrated by example
- Consulting for context: questions to ask
- The 3‐minute story & Big Idea
- Storyboarding
- In closing
- chapter two choosing an effective visual
- Simple text
- Tables
- Graphs
- Points
- Lines
- Bars
- Area
- Other types of graphs
- To be avoided
- In closing
- chapter three clutter is your enemy!
- Cognitive load
- Clutter
- Gestalt principles of visual perception
- Lack of visual order
- Non‐strategic use of contrast
- Decluttering: step‐by‐step
- In closing
- chapter four focus your audience’s attention
- You see with your brain
- A brief lesson on memory
- Preattentive attributes signal where to look
- Preattentive attributes in text
- Preattentive attributes in graphs
- Size
- Color
- Position on page
- In closing
- chapter five think like a designer
- Affordances
- Accessibility
- Aesthetics
- Acceptance
- In closing
- chapter six dissecting model visuals
- Model visual #1: line graph
- Model visual #2: annotated line graph with forecast
- Model visual #3: 100% stacked bars
- Model visual #4: leveraging positive and negative stacked bars
- Model visual #5: horizontal stacked bars
- In closing
- chapter seven lessons in storytelling
- The magic of story
- Constructing the story
- The narrative structure
- The power of repetition
- Tactics to help ensure that your story is clear
- In closing
- chapter eight pulling it all together
- Lesson 1: understand the context
- Lesson 2: choose an appropriate display
- Lesson 3: eliminate clutter
- Lesson 4: draw attention where you want your audience to focus
- Lesson 5: think like a designer
- Lesson 6: tell a story
- In closing
- chapter nine case studies
- CASE STUDY 1: Color considerations with a dark background
- CASE STUDY 2: Leveraging animation in the visuals you present
- CASE STUDY 3: Logic in order
- CASE STUDY 4: Strategies for avoiding the spaghetti graph
- CASE STUDY 5: Alternatives to pies
- In closing
- chapter ten final thoughts
- Where to go from here
- Building storytelling with data competency in your team or organization
- Recap: a quick look at all we’ve learned
- In closing
- bibliography
- Index
