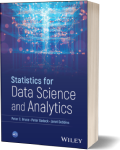
Statistics for Data Science and Analytics Edition: 1
Data Science
Book Details
Book Title
Statistics for Data Science and Analytics Edition: 1
Author
Peter C. Bruce; Peter Gedeck; Janet Dobbins
Publisher
Wiley
Publication Date
2024
ISBN
9781394253807
Number of Pages
366
Language
English
Format
File Size
3.8MB
Subject
Computers > Software: Systems: scientific computing
Table of Contents
- Front Matter
- Title Page
- Copyright
- Contents
- About the Authors
- Acknowledgments
- About the Companion Website
- Introduction
- Chapter 1
- 1.1 Big Data: Predicting Pregnancy
- 1.2 Phantom Protection from Vitamin E
- 1.3 Statistician, Heal Thyself
- 1.4 Identifying Terrorists in Airports
- 1.5 Looking Ahead
- 1.6 Big Data and Statisticians
- Chapter 2
- 2.1 Statistical Science
- 2.2 Big Data
- 2.3 Data Science
- 2.4 Example: Hospital Errors
- 2.5 Experiment
- 2.6 Designing an Experiment
- 2.7 The Data
- 2.8 Variables and Their Flavors
- 2.9 Python: Data Structures and Operations
- 2.10 Are We Sure We Made a Difference?
- 2.11 Is Chance Responsible? The Foundation of Hypothesis Testing
- 2.12 Probability
- 2.13 Significance or Alpha Level
- 2.14 Other Kinds of Studies
- 2.15 When to Use Hypothesis Tests
- 2.16 Experiments Falling Short of the Gold Standard
- 2.17 Summary
- 2.18 Python: Iterations and Conditional Execution
- 2.19 Python: Numpy, scipy, and pandas—The Workhorses of Data Science
- Exercises
- Chapter 3
- 3.1 Exploratory Data Analysis
- 3.2 What to Measure—Central Location
- 3.3 What to Measure—Variability
- 3.4 What to Measure—Distance (Nearness)
- 3.5 Test Statistic
- 3.6 Examining and Displaying the Data
- 3.7 Python: Exploratory Data Analysis/Data Visualization
- Exercises
- Chapter 4
- 4.1 Avoid Being Fooled by Chance
- 4.2 The Null Hypothesis
- 4.3 Repeating the Experiment
- 4.4 Statistical Significance
- 4.5 Power
- 4.6 The Normal Distribution
- 4.7 Summary
- 4.8 Python: Random Numbers
- Exercises
- Chapter 5
- 5.1 What Is Probability
- 5.2 Simple Probability
- 5.3 Probability Distributions
- 5.4 From Binomial to Normal Distribution
- 5.5 Appendix: Binomial Formula and Normal Approximation
- 5.6 Python: Probability
- Exercises
- Chapter 6
- 6.1 Two‐way Tables
- 6.2 Conditional Probability
- 6.3 Bayesian Estimates
- 6.4 Independence
- 6.5 Multiplication Rule
- 6.6 Simpson's Paradox
- 6.7 Python: Counting and Contingency Tables
- Exercises
- Chapter 7
- 7.1 Literary Digest—Sampling Trumps “All Data”
- 7.2 Simple Random Samples
- 7.3 Margin of Error: Sampling Distribution for a Proportion
- 7.4 Sampling Distribution for a Mean
- 7.5 The Bootstrap
- 7.6 Rationale for the Bootstrap
- 7.7 Standard Error
- 7.8 Other Sampling Methods
- 7.9 Absolute vs. Relative Sample Size
- 7.10 Python: Random Sampling Strategies
- Exercises
- Chapter 8
- 8.1 Count Data—R × C Tables
- 8.2 The Role of Experiments (Many Are Costly)
- 8.3 Chi‐Square Test
- 8.4 Single Sample—Goodness‐of‐Fit
- 8.5 Numeric Data: ANOVA
- 8.6 Components of Variance
- 8.7 Factorial Design
- 8.8 The Problem of Multiple Inference
- 8.9 Continuous Testing
- 8.10 Bandit Algorithms
- 8.11 Appendix: ANOVA, the Factor Diagram, and the F‐Statistic
- 8.12 More than One Factor or Variable—From ANOVA to Statistical Models
- 8.13 Python: Contingency Tables and Chi‐square Test
- 8.14 Python: ANOVA
- Exercises
- Chapter 9
- 9.1 Example: Delta Wire
- 9.2 Example: Cotton Dust and Lung Disease
- 9.3 The Vector Product Sum Test
- 9.4 Correlation Coefficient
- 9.5 Correlation is not Causation
- 9.6 Other Forms of Association
- 9.7 Python: Correlation
- Exercises
- Chapter 10
- 10.1 Finding the Regression Line by Eye
- 10.2 Finding the Regression Line by Minimizing Residuals
- 10.3 Linear Relationships
- 10.4 Prediction vs. Explanation
- 10.5 Python: Linear Regression
- Exercises
- Chapter 11
- 11.1 Terminology
- 11.2 Example—Housing Prices
- 11.3 Interaction
- 11.4 Regression Assumptions
- 11.5 Assessing Explanatory Regression Models
- 11.6 Assessing Regression for Prediction
- 11.7 Python: Multiple Linear Regression
- Exercises
- Chapter 12
- 12.1 K‐Nearest‐Neighbors
- 12.2 Python: Classification
- Exercises
- Index
